


If you’re not familiar with Google Analytics, it can be intimidating at first. With so much data available to dig through, it’s hard to know where to look to find the most important metrics.
Marketers that want to better understand their audience, and strengthen their marketing strategy, need to know how to best utilize all of the data available inside Google Analytics.
Without knowing which sections to pay attention to, you could spend hours digging through the platform and walk away with your head spinning.
Similarly, without analyzing your website traffic, it’s hard to assess the effectiveness of your current marketing strategy and know when it’s time to make a shift.
If leveraged correctly, Google Analytics can provide valuable insight into who visits your website, how they got there in the first place and what pages they spend the most time on; this is powerful data for marketers that can be used to enhance their strategy.
An Overview
Google Analytics is a powerful tool for brands, bloggers or businesses 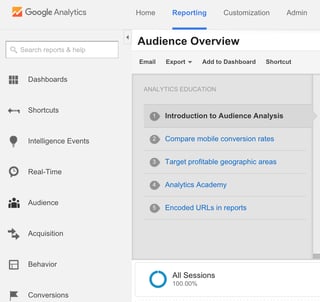 alike. Through use of Google Analytics, you can uncover a tremendous amount of data about your website that can be used to enhance your marketing and business development strategies.
The back end of Google Analytics is broken down into eight main sections: Dashboards, Shortcuts, Intelligence Events, Real-Time, Audience, Acquisition, Behavior & Conversions.
Almost all eight sections contain sub-sections that provide a ton of data, but not all sections are critical for marketers to pay attention to.
Here are some basic Google Analytics terminology:
- Users: These are people who have visited at least once within your selected date range, and includes both new and returning visitors.
- Dimensions: These are descriptive characteristics of an object. For example, browser, exit page and session duration are all considered dimensions.
- Metrics: These are individual statistics of a dimension, such as Average Session Duration or Screen views.
- Bounce Rate: This is the percentage of single-page visits, meaning that someone left your site from the same page at which they entered; aka, they didn’t interact with your site.
- Sessions: A session is the period of time that a user is actively engaged with your website.
Now that you’re familiar with the Google Analytics sections and terminology, let’s dive in to the areas that you want to pay most attention to in order to save time and strengthen your marketing strategy.
Zeroing in on what matters most
There are three sections that matter most to marketers: Audience, Acquisition, and Behavior. 
The Audience section provides a tremendous amount of data about your website visitors. It contains multiple subsections that provide information about the gender, age and location of your website visitors. You can also uncover information about their interests, as well as the browsers and mobile devices used to access your site.
The Acquisition section will provide detailed information about how people arrive to your site. Digging in to the “All Traffic” tab will show you exactly how people are arriving at your website – whether it be a search engine, social media site or blog that you’re a contributor for.

The Behavior section helps you understand how people are interacting with your site. You’ll visit this section to better understand which pages on your website are the most popular .
Focusing on these three sections will help you save time when digging through Google Analytics.
When used together, the information uncovered can help you make decisions about which marketing efforts (be it guest blogging or social media posting,) are most useful in driving website traffic.
Analyzing these sections within Google Analytics will provide you with insight that will enable you to make smarketing (smart, marketing) decisions about the type, tone, and placement of content that you use on your website.
Traffic Channels
To see your various traffic sources for a set period of time, go to the Acquisition tab and click the “All Traffic” dropdown. Select the “Channels” button, set the time period at the top of the viewing pane and scroll down to see the results for the give timeframe. 
Here’s a simple breakdown of what these different channels mean:
- Direct: Visitors that came directly to your website. They either typed your URL right into their browser, clicked on a bookmark or clicked a link in an email. Direct traffic is a strong indicator of the strength of your brand.
- Organic Search: You can thank search engines like Google and Bing for these website visitors. An organic visitor is someone who got to your website by clicking on a link from a search engine results page. A lot of organic traffic is a strong indicator of the value of your content and SEO strategy.
- Paid Search: You’ll find any paid search (think Google AdWords) campaigns in this viewing pane. A lot of paid search traffic means that you’re Google AdWords are working well.
- Referral: This represents visitors that clicked a link on another site to land on your website. Years ago, before social media was what it is today, all other traffic (that wasn’t direct or organic) fell under the referral tab. Within the past few years, Google created a separate tab for social traffic, which makes it easy for marketers to focus in on just the websites that are driving traffic to their site. A lot of referral traffic means that you’re being talked about (and linked to) from multiple other websites.
- Social: As a social media marketer, this is my favorite section within Google Analytics because it shows me exactly what social media channels drive the majority of traffic to my site. This data can be used to shape your social media strategy.
- Email: The number of visitors that came to your website from an email campaign. If you focus on email marketing, you’ll want to dig through here to see how effective your campaigns are.
Looking at the traffic channels will allow you to see which channel is the largest driver of traffic to your site. You’ll notice that the Channels are listed in order of driving power; the Channel at the top is the one that drives the majority of site traffic.
To dig deeper into the data, click each Channel to see more information.
For example, when you click Social, you can see the entire list of social media sites (listed in order of most to least powerful) that drove traffic to the website during the selected timeframe. 
Analyzing the power of different channels will help you decide which efforts to focus on, and potentially spark ideas to increase traffic from other channel types.
Here are a few ideas to increase traffic across all channel types:
- Direct: Share the link to your website with friends and family the next time you’re with them. Tell them to type it directly into their browser.
- Organic Search: Make sure that you’re utilizing H1 and H2 (header 1 and 2) tags, meta descriptions and keywords in all of your website pages and content updates. The stronger your SEO, the greater likelihood that someone will find you on a search engine.
- Paid Search: Try adjusting your keywords and/or targeting options to make your ads more relevant.
- Referral: Start reaching out to popular blogs and forums in your industry to see if you can guest post or perhaps be featured on their site. Contributing content to other sites is a great way to increase your referral traffic.
- Social: Increasing the frequency of your posting, and the number of links you share on social media will undoubtedly result in a boost of social traffic. I recommend increasing your efforts on one channel at a time to see what drives the largest impact. For example, make February your Twitter month; aim to tweet a lot of links that drive back to your website and at the end of the month, analyze the website traffic. Then, come March, turn that attention over to Facebook and see which social channel drove more traffic. (If you want to learn how to see which social media channels drive the most traffic to your website, refer to this Kissmetrics blog post on setting up Advanced Segments.
- Email: Start including more calls to action and links in your email campaigns. Make sure that your calls to action stand out in your email templates and serve to drive people back to your website.
Once you’ve implemented some of these ideas, take the time to review the Channels breakdown again to see the impact of your efforts.
If your efforts to grow traffic from one channel go unnoticed in your analytics, try a different one!
Audience Demographics
Understanding who is visiting your site in terms of their age, location and gender is the best way to tailor your site to suit their interests and preferences.
If you want your website content and imagery to appeal and resonate with your audience, you need to know who they are.
To find this information, head over to the Audience tab. You’ll want to focus on the sub-sections of Demographics and Geo.
First, let’s look at the Demographics of Age and Gender.
As you can see, the majority of my website visitors are aged 25-34, followed by those aged 35-44.

Knowing this, aim to create content that is geared towards, and valued by, young professionals. Some examples are tips for professional development and advice for managers leading a team of employees.
Understanding how old your website visitors are, and whether they’re male or female, is helpful if you’re looking to capture their attention when they land on your site.
For example, if 90% of your website visitors are women, you could deliver a more personalized website experience for them by starting your “About” or “Welcome” page with “Hey ladies!”

Through analyzing the Gender section, you can see that the majority of the site visitors are female. It’s not skewed too heavily though, so you wouldn't want to tailor the site to females only. Choosing website colors to be black, white and green; will create a sleek and clean aesthetic that would be appealing to both men and women.
Digging in to the age and gender of your website visitors is useful if you want to craft creative content for your blog posts and website pages that captures their attention and gains their trust.
Finally, you want to look to see where your website visitors are from. Looking at the Location tab under the “Geo” dropdown will show you the countries, states and cities of your website audience.

When you first click “Location” you’ll be shown the list of countries. Not surprisingly, the majority of the website visitors are from the United States.
Looking at the different states is a great way to gain insight that can be levered for any AdWords or paid Facebook campaigns you’re going to run. You want to target those states and cities that you see are frequenting your site. 
Clicking on the individual states will bring you to the list of cities, within that state, that your website visitors come from. 
If you don’t see your city as the top city, you might want to consider shifting your marketing strategy, and content, to target those in your geographic area.
Content Drilldown
Last but not least, it’s important to dive in to the content to see which pages people spend the most and least time on.
To do this, click the Behavior tab and go to the Site Content drop-down. You’ll want to look at the Content Drilldown, as well as Landing and Exit Pages to see which pages are most viewed on your website.
Content Drilldown is the overview of which pages on your website are visited the most.
Seeing which pages, and blog posts, are most viewed by your audience is helpful in guiding your web development strategy; you want to create more of what works. 
Through analysis, you can see that the homepage and services page are the most popular. Also, that the page on the site that has all of the marketing blogs is more popular than the blog page itself, which shows the audience values marketing content.
The Landing Pages view is a good indicator of the effectiveness of your social media and promotional strategy, as you hope to see the blogs and website pages promoted most at the top.

If you don’t see your most important and/or promoted blog posts and website pages in the list of the top ten landing pages, it’s time to either reevaluate their value and/or your promotional strategy to ensure you’re driving traffic to those pages through social media and email marketing campaigns.
Spending time in the behavior section will allow you to develop an awareness of what content your website visitors find the most valuable. You can use this as a guide for what works (and what doesn’t) when it comes to blog topics and page types.
For example, if you notice that the top visited pages are all blog posts about social media, yet none of your design blogs are ranking in the top, you want to spend more time blogging about social than you do about design.
You may be using Google Analytics, but are you using it to its full potential?
Google Analytics is an incredibly powerful tool.
Tapp Network can utilize, analyze, and focus on these various sections within Google Analytics, giving you a deeper understanding of who your audience is, what they want and how they find you.
By analyzing the demographics of your audience, we are able to create content and imagery that your audience desires. Enabling us to craft a customized and relevant site experience for your audience that will keep them coming back for more.